Market Outlook
February 21, 2018
Market Cues
Domestic Indices
Chg (%)
(Pts)
(Close)
Indian markets are likely to open positive tracking global indices and SGX Nifty.
BSE Sensex
(0.2)
(71)
33,704
US stocks showed a lack of direction over the course of the trading session before
Nifty
(0.2)
(18)
10,360
ending the session modestly lower. The Dow Jones ended on a downside front of
Mid Cap
(0.1)
(9)
16,420
1.0% to close at 24,965 and the Nasdaq Composite edged down to 0.1%, to 7,234.
Small Cap
(0.1)
(26)
17,831
Bankex
(0.6)
(172)
28,061
U.K. shares were trading lower as investors weighed disappointing earnings updates
from the likes of HSBC Holdings and BHP Billiton. The FTSE 100 was ended on a flat
note at 7,247.
Global Indices
Chg (%)
(Pts)
(Close)
Dow Jones
(1.0)
(255)
24,965
On domestic front, Indian shares succumbed to selling pressure for the third day as
Nasdaq
(0.1)
(5)
7,234
worries intensified about fallout from a $1.77 billion fraud at Punjab National Bank
and investors waited for the minutes of the latest Federal Reserve meeting for clues
FTSE
(0.0)
(1)
7,247
on the U.S. rate outlook. The Sensex ended on a downside front of 0.2% at 33,704
Nikkei
0.6
139
22,065
while the Nifty ended at 10,360 with a downside of 0.2%.
Hang Seng
1.0
301
31,175
Shanghai Com
0.4
14
3,199
News Analysis
Initiating Coverage on Safari Industries: CMP `553; TP `650; Upside-17%
Advances / Declines
BSE
NSE
Detailed analysis on Pg2
Advances
1,253
792
Investor’s Ready Reckoner
Declines
1,526
965
Unchanged
143
75
Key Domestic & Global Indicators
Stock Watch: Latest investment recommendations on 150+ stocks
Refer Pg5 onwards
Volumes (` Cr)
BSE
3,440
Top Picks
NSE
27,137
CMP
Target
Upside
Company
Sector
Rating
(`)
(`)
(%)
Blue Star
Capital Goods
Buy
720
867
20.4
Net Inflows (` Cr)
Net
Mtd
Ytd
Dewan Housing Finance
Financials
Buy
545
712
30.6
FII
1,157
(5,422)
7,562
Century Plyboards
Forest Products
Buy
314
400
27.6
Navkar Corporation
Other
Buy
166
265
59.2
*MFs
(139)
5,352
14,375
KEI Industries
Capital Goods
Buy
375
436
16.4
More Top Picks on Pg4
Top Gainers
Price (`)
Chg (%)
Key Upcoming Events
JINDALSAW
134
5.4
Previous
Consensus
Date
Region
Event Description
FORTIS
153
4.9
Reading
Expectations
Feb21
Germany PMI Services
57.30
57.00
SYNDIBANK
58
4.8
Feb21
US
Existing home sales
5.57
5.62
APOLLOTYRE
265
4.2
Feb21
Germany PMI Manufacturing
61.10
60.50
IDBI
66
3.9
Feb21
UK
Jobless claims change
8.60
Feb22
Germany
GDP nsa (YoY)
2.30
2.30
Top Losers
Price (`)
Chg (%)
More Events on Pg7
ASTRAMICRO
96
-6.1
PRESTIGE
302
-5.9
VAKRANGEE
222
-5.0
RELIGARE
60
-5.0
LTTS
1267
-4.4
As on February 20 2018
Market Outlook
February 21, 2018
News Analysis
Initiating Coverage on Safari Industries
Buy CMP -`553
Target price-`650
Upside-17%
Safari Industries Ltd (Safari ) is the third largest branded player in the Indian
luggage industry. Post the management change in
2012; it has witnessed
complete restructuring in business and product portfolio. This restructuring has
helped it in posting a CAGR of 42% in revenue and 46% in PAT over 2012-17. It
has also now captured a market share of ~ 12% in a `2800cr organised luggage
market. We expect this growth trajectory to continue with its strong focus on
introduction of new products and improving marketing and distribution strategy.
Outlook and Valuation: We feel that the company is in sweet spot where its
increasing product offerings would be benefitted by the favorable industry
dynamics like increasing travel spend and disposable income. We expect Safari to
report a top-line CAGR of ~23% over FY2017-20E on the back of increased
product offerings across categories. On the bottom-line front, we expect the
company to report a whopping ~59% CAGR over the same period, owing to
improving margins. Further, with improving scale, the company is in better
position to negotiate with the Chinese suppliers. Currently, it is trading at a P/E of
31x its FY2020E EPS. We Initiate Coverage on the stock with a Buy
recommendation and Target Price of `650 (36x FY2020E EPS), indicating an
upside of ~17%.
Y/E March (` cr)
FY2017E
FY2018E
FY2019E
FY2020E
Net Sales
359
409
532
665
% chg
29.0
14.0
30.0
25.0
Net Profit
10.4
20.4
29.3
40.0
% chg
33.8
96.2
43.6
36.4
OPM (%)
6.3
9.4
9.8
10.3
EPS (`)
4.7
9.2
13.2
18.0
P/E (x)
118.2
60.3
42.0
30.8
P/BV (x)
11.9
10.0
8.2
6.5
RoE (%)
10.4
17.2
20.1
21.9
RoCE (%)
12.1
19.6
23.5
26.3
EV/Sales (x)
3.5
3.1
2.4
1.9
EV/EBITDA (x)
56.5
32.8
24.2
18.4
Economic and Political News
EPFO likely to retain 8.65% interest for 50 million members in 2017-18
Rotomac fraud: Bank of Baroda has exposure of Rs 4.56 billion
Corporate News
Wipro unveils affordable integrated home automation system for smart
home
BSNL launches unlimited mobile plan at Rs 99, 4G roll-out likely from March
InvIT IndiGrid to make first third-party acquisition for Rs 2 billion
Textile industry faces crunch as rebate scheme backlog hits Rs 16 billion
Market Outlook
February 21, 2018
Top Picks
Market Cap
CMP
Target
Upside
Company
Rationale
(` Cr)
(`)
(`)
(%)
Strong growth in domestic business due to its leade`hip
in acute therapeutic segment. Alkem expects to launch
Alkem Laboratories
25,958
2,171
2,441
12.4
more products in USA, which bodes for its international
business.
Favorable outlook for the AC industry to augur well for
Cooling products business which is out pacing the
Blue Star
6,909
720
867
20.4
market growth. EMPPAC division's profitability to
improve once operating environment turns around.
With a focus on the low and medium income (LMI)
consumer segment, the company has increased its
Dewan Housing Finance
17,098
545
712
30.6
presence in tier-II & III cities where the growth
opportunity is immense.
Loan growth is likely to pick up after a sluggish FY17.
Lower credit cost will help in strong bottom-line growth.
Karur Vysya Bank
8,039
111
160
44.6
Increasing share of CASA will help in NIM
improvement.
High order book execution in EPC segment, rising B2C
KEI Industries
2,935
375
436
16.4
sales and higher exports to boost the revenues and
profitability
Expected to benefit from the lower capex requirement
Music Broadcast
2,069
363
475
31.0
and 15 year long radio broadcast licensing.
Massive capacity expansion along with rail advantage
Navkar Corporation
2,505
166
265
59.2
at ICD as well CFS augur well for the company
Strong brands and distribution network would boost
Siyaram Silk Mills
3,046
650
851
31.0
growth going ahead. Stock currently trades at an
inexpensive valuation.
Market leadership in Hindi news genre and no.
2
viewership ranking in English news genre, exit from the
TV Today Network
2,842
476
560
17.5
radio business, and anticipated growth in ad spends by
corporate to benefit the stock.
After GST, the company is expected to see higher
volumes along with improving product mix. The Gujarat
Maruti Suzuki
2,63,559
8,725
10,619
21.7
plant will also enable higher operating leverage which
will be margin accretive.
We expect loan book to grow at 24.3% over next two
GIC Housing
2,139
397
655
64.9
year; change in borrowing mix will help in NIM
improvement
We expect CPIL to report net Revenue/PAT CAGR of
~17%/16% over FY2017-20E mainly due to healthy
6,966
314
400
27.6
growth in plywood & lamination business, forayed into
Century Plyboards India
MDF & Particle boards on back of strong brand &
distribution network.
We expect sales/PAT to grow at 13.5%/20% over next
LT Foods
3,013
94
128
35.9
two years on the back of strong distribution network &
addition of new products in portfolio.
We expect financialisation of savings and increasing
Aditya Birla Capital
36204
164
230
39.0
penetration in Insurance & Mutual fund would ensure
steady growth.
Third largest brand play in luggage segment Increased
product offerings and improving distribution network is
Safari Industries
1230
553
650
17%
leading to strong growth in business. Likely to post
robust growth for next 3-4 years
We expect HSIL to report PAT CAGR of ~15% over
FY2017-20E owing to better improvement in operating
HSIL
3081
415
510
22.9
margin due price hike in container glass segment,
turnaround in consumer business.
Source: Company, Angel Research
Market Outlook
February 21, 2018
Fundamental Call
Market Cap
CMP
Target
Upside
Company
Rationale
(` Cr)
(`)
(`)
(%)
CCL is likely to maintain the strong growth trajectory
CCL Products
3,751
282
360
27.7
over FY18-20 backed by capacity expansion and new
geographical foray
We forecast Nilkamal to report top-line CAGR of ~9%
to `2,635cr over FY17-20E on the back of healthy
Nilkamal
2,534
1,698
2,178
28.3
demand growth in plastic division. On the bottom-line
front, we estimate ~10% CAGR to `162cr owing to
improvement in volumes.
We expect sales/PAT to grow at 9%/14% over next two
years on the back of healthy demand growth in
Shreyans Industries
221
160
247
54.7
printing. Further, China had banned making paper
from waste pulp which would benefit Indian paper
companies.
The prism has diversified exposure in the different
segment such as Cement, Tile & ready mix concrete.
Prism Cement
6,189
123
160
30.1
Thus we believe, PCL is in the right place to capture
ongoing government spending on affordable housing
and infrastructure projects.
Source: Company, Angel Research
Market Outlook
February 21, 2018
Key Upcoming Events
Global economic events release calendar
Bloomberg Data
Date
Time Country
Event Description
Unit
Period
Last Reported
Estimated
Feb 21, 2018
2:00 PMGermany
PMI Services
Value
Feb P
57.30
57.00
8:30 PMUS
Existing home sales
Million
Jan
5.57
5.62
2:00 PMGermany
PMI Manufacturing
Value
Feb P
61.10
60.50
3:00 PMUK
Jobless claims change
% Change
Jan
8.60
Feb 22, 2018
12:30 PMGermany
GDP nsa (YoY)
% Change
4Q F
2.30
2.30
7:00 PMUS
Initial Jobless claims
Thousands
Feb 17
230.00
230.00
Feb 23, 2018
3:00 PMUK
GDP (YoY)
% Change
4Q P
1.50
1.50
3:30 PMEuro Zone
Euro-Zone CPI (YoY)
%
Jan F
1.30
1.30
Feb 26, 2018
8:30 PMUS
New home sales
Thousands
Jan
625.00
646.50
Feb 27, 2018
8:30 PMUS
Consumer Confidence
S.A./ 1985=100
Feb
125.40
126.00
Feb 28, 2018
2:25 PMGermany
Unemployment change (000's)
Thousands
Feb
(24.00)
6:30 AMChina
PMI Manufacturing
Value
Feb
51.30
7:00 PMUS
GDP Qoq (Annualised)
% Change
4Q S
2.60
2.60
Mar 01, 2018
3:00 PMUK
PMI Manufacturing
Value
Feb
55.30
Mar 07, 2018
3:30 PMEuro Zone
Euro-Zone GDP s.a. (QoQ)
% Change
4Q F
0.60
Mar 08, 2018
China
Exports YoY%
% Change
Feb
11.10
3:00 PMUK
Industrial Production (YoY)
% Change
Jan
-
Mar 09, 2018
6:15 PMEuro Zone
ECB announces interest rates
%
Mar 8
-
7:00 AMChina
Consumer Price Index (YoY)
% Change
Feb
1.50
7:00 PMUS
Change in Nonfarm payrolls
Thousands
Feb
200.00
200.00
7:00 PMUS
Unnemployment rate
%
Feb
4.10
4.10
Mar 12, 2018
5:30 PMIndia
Industrial Production YoY
% Change
Jan
7.10
Mar 13, 2018
6:00 PMUS
Consumer price index (mom)
% Change
Feb
0.50
Mar 14, 2018
12:00 PMIndia
Monthly Wholesale Prices YoY%
% Change
Feb
2.84
Source: Bloomberg, Angel Research
Market Outlook
February 21, 2018
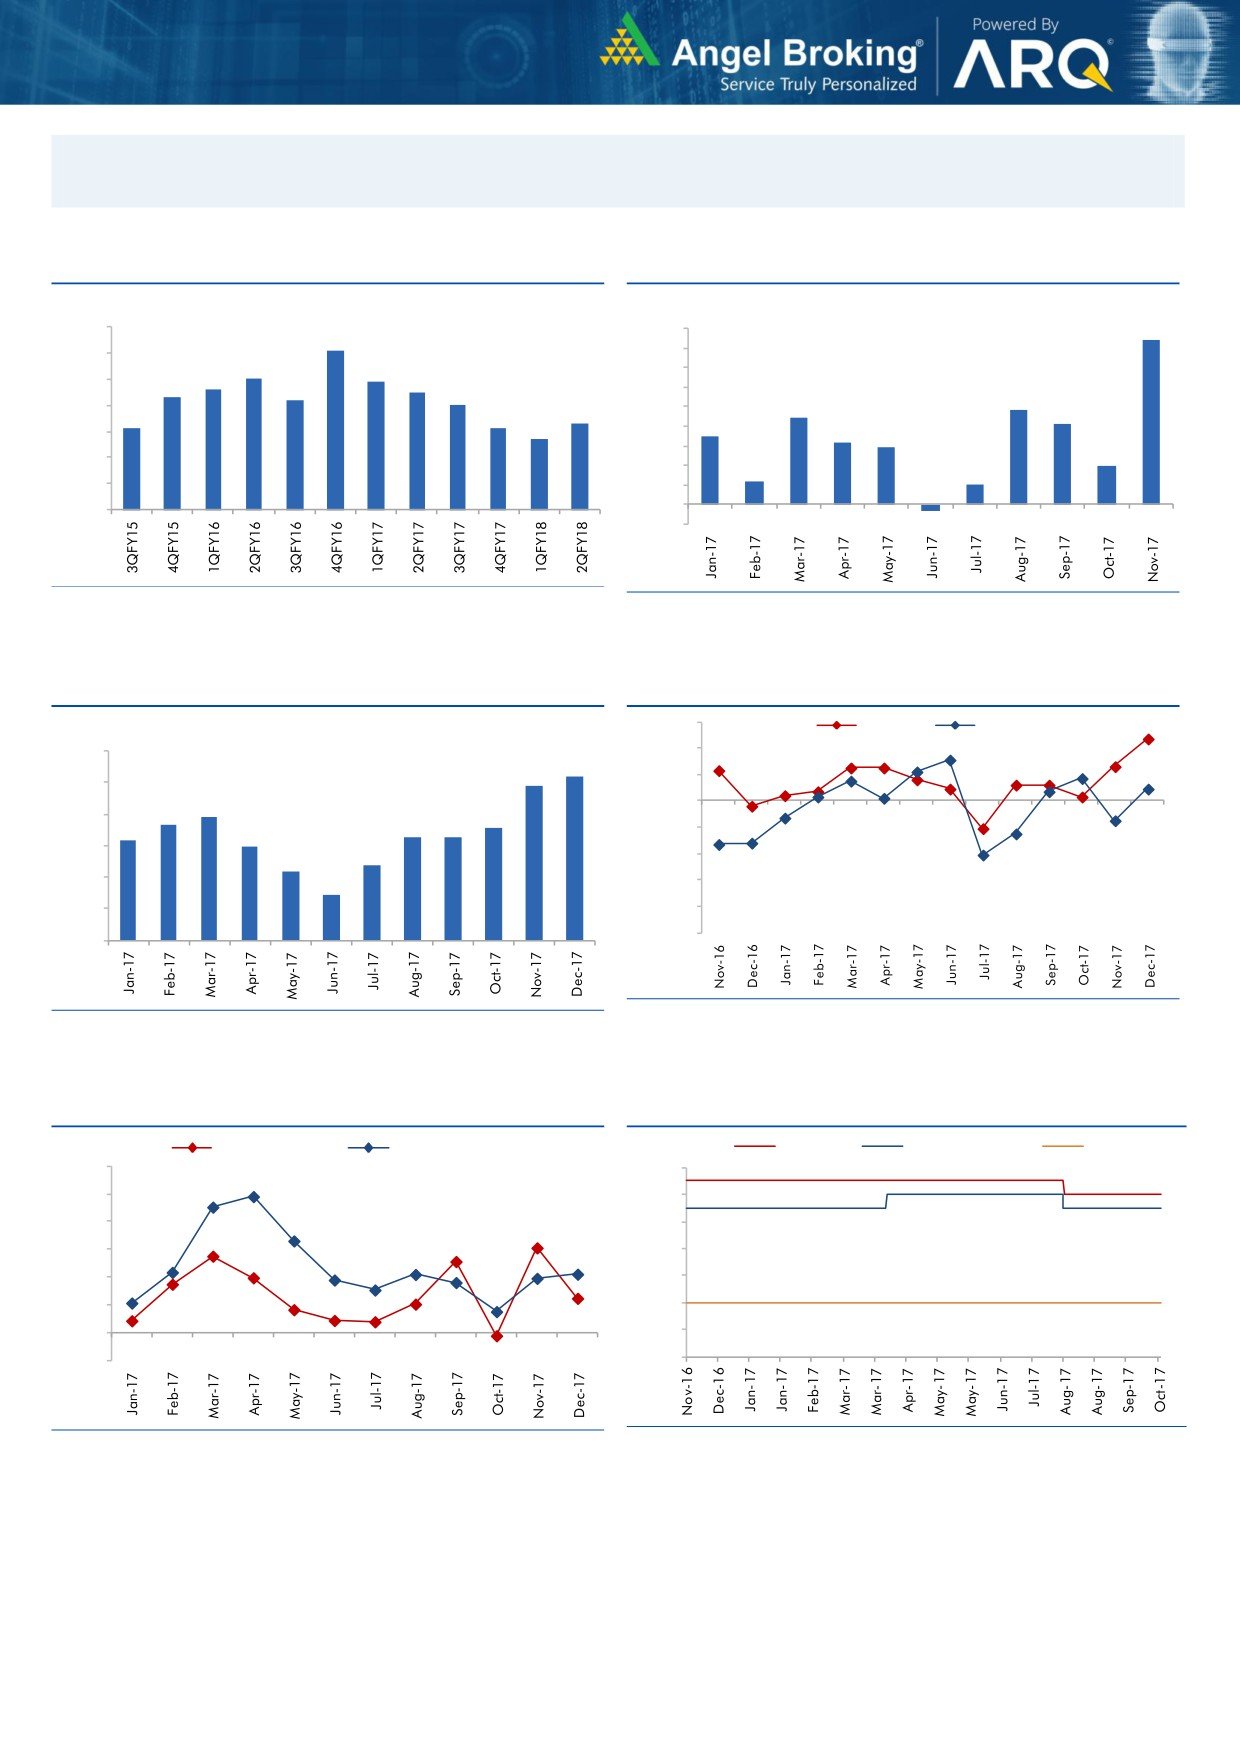
Macro watch
Exhibit 1: Quarterly GDP trends
Exhibit 2: IIP trends
(%)
(%)
10.0
9.0
8.4
9.1
9.0
8.0
8.0
7.9
7.0
7.6
7.5
8.0
7.3
7.2
7.0
6.0
4.8
7.0
6.3
5.0
4.4
4.1
6.1
6.1
5.7
3.5
3.2
6.0
4.0
2.9
3.0
2.0
5.0
2.0
1.2
1.0
4.0
1.0
-
3.0
(1.0)
(0.3)
Source: CSO, Angel Research
Source: MOSPI, Angel Research
Exhibit 3: Monthly CPI inflation trends
Exhibit 4: Manufacturing and services PMI
56.0
Mfg. PMI
Services PMI
(%)
6.0
54.0
5.2
4.9
52.0
5.0
3.9
50.0
3.7
3.6
4.0
3.3
3.3
3.2
3.0
48.0
3.0
2.4
2.2
46.0
2.0
1.5
44.0
1.0
42.0
40.0
-
Source: Market, Angel Research; Note: Level above 50 indicates expansion
Source: MOSPI, Angel Research
Exhibit 5: Exports and imports growth trends
Exhibit 6: Key policy rates
(%)
Exports yoy growth
Imports yoy growth
(%)
Repo rate
Reverse Repo rate
CRR
60.0
6.50
50.0
6.00
40.0
5.50
30.0
5.00
20.0
4.50
10.0
4.00
0.0
3.50
(10.0)
3.00
Source: Bloomberg, Angel Research
Source: RBI, Angel Research
Market Outlook
February 21, 2018
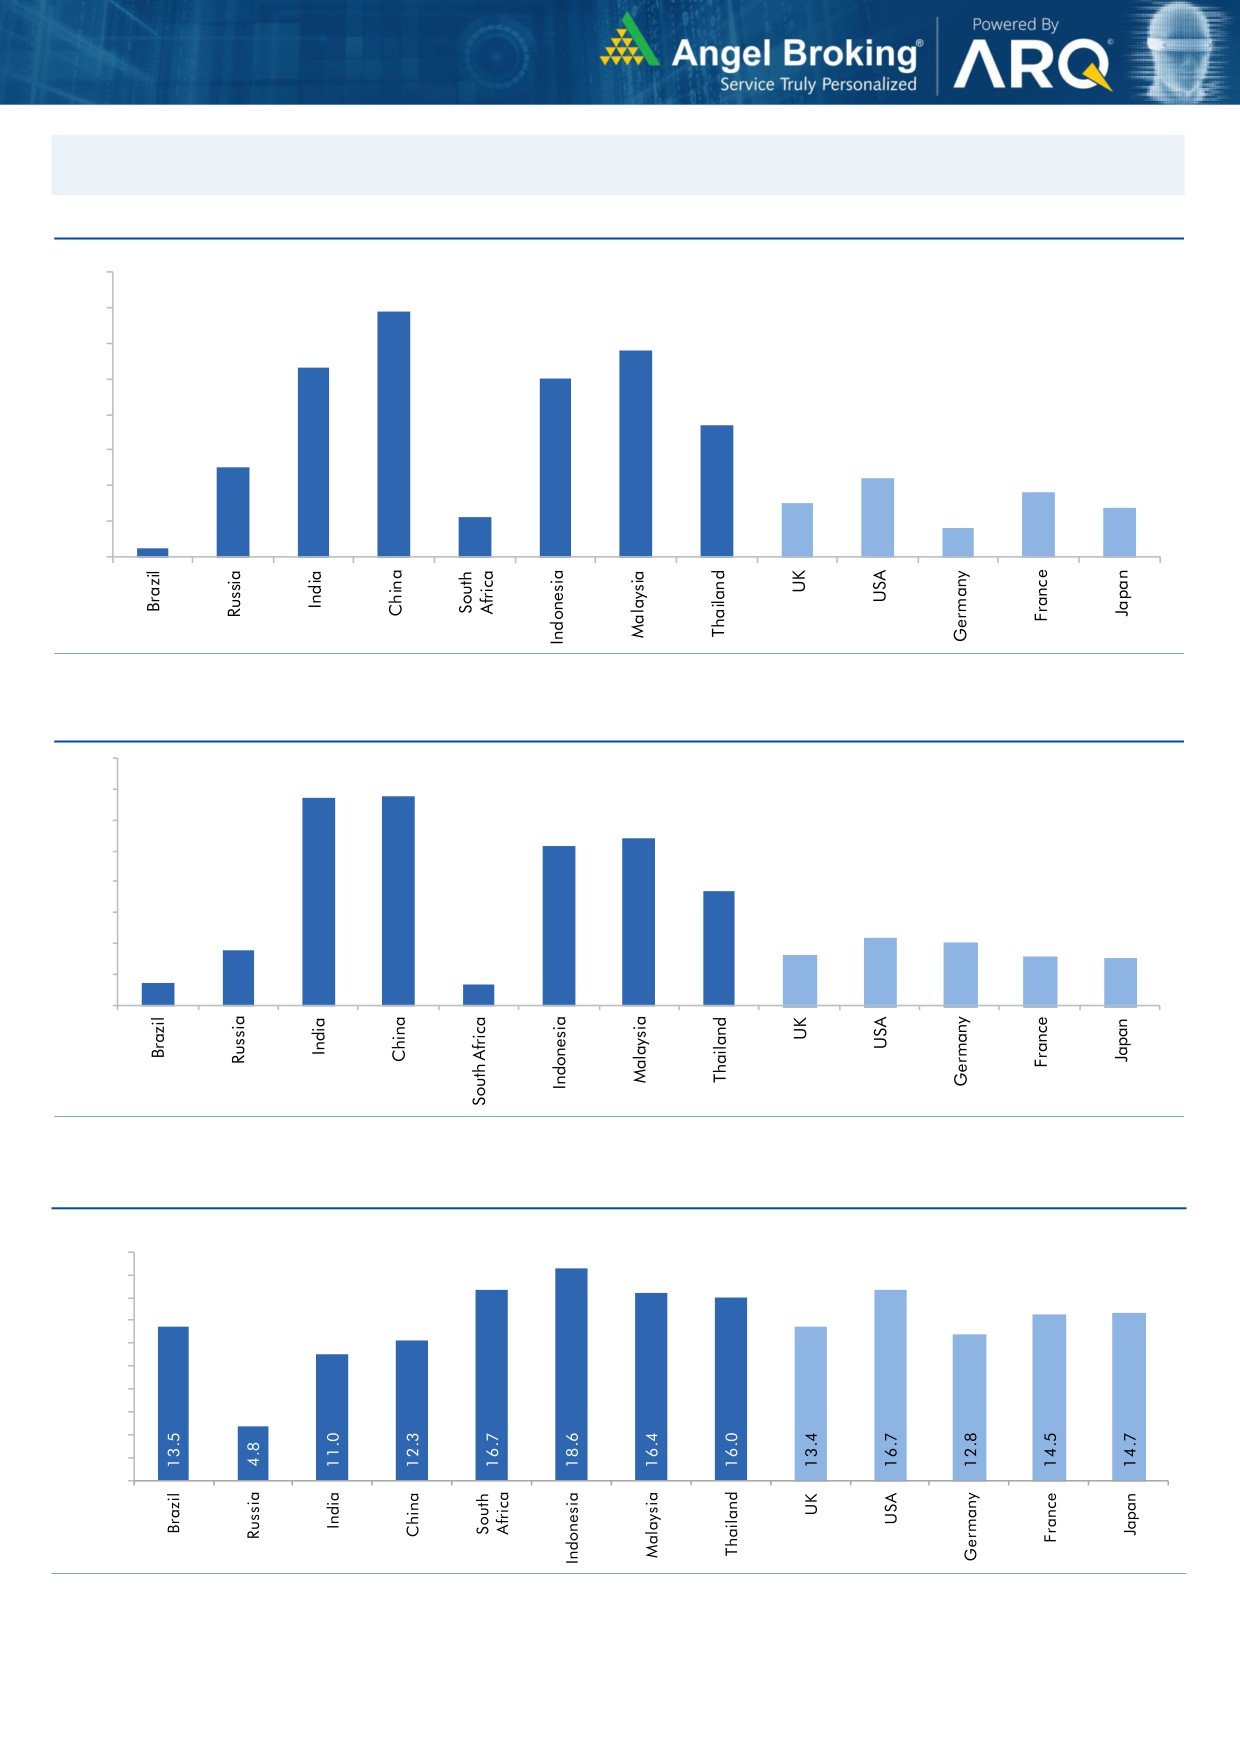
Global watch
Exhibit 1: Latest quarterly GDP Growth (%, yoy) across select developing and developed countries
(%)
8.0
6.9
7.0
5.8
6.0
5.3
5.0
5.0
1.1
3.7
4.0
2.5
3.0
2.2
1.8
2.0
1.5
1.4
0.8
1.0
0.3
-
Source: Bloomberg, Angel Research
Exhibit 2: 2017 GDP Growth projection by IMF (%, yoy) across select developing and developed countries
(%)
6.7
6.8
7.0
6.0
5.4
5.2
5.0
3.7
4.0
3.0
1.8
2.2
2.0
1.7
1.6
2.0
0.7
1.5
0.7
1.0
-
Source: IMF, Angel Research
Exhibit 3: One year forward P-E ratio across select developing and developed countries
(x)
20.0
18.0
16.0
14.0
12.0
10.0
8.0
6.0
4.0
2.0
-
Source: IMF, Angel Research
Market Outlook
February 21, 2018
Exhibit 4: Relative performance of indices across globe
Returns (%)
Country
Name of index
Closing price
1M
3M
1YR
Brazil
Bovespa
85,804
7.5
18.9
32.1
Russia
Micex
2,270
(0.7)
6.5
7.1
India
Nifty
10,360
(4.0)
0.7
18.7
China
Shanghai Composite
3,199
(6.2)
(6.0)
(0.5)
South Africa
Top 40
51,020
(5.6)
(5.4)
13.2
Mexico
Mexbol
48,685
(2.5)
2.1
3.4
Indonesia
LQ45
1,122
1.9
11.3
25.8
Malaysia
KLCI
1,856
1.6
7.1
9.2
Thailand
SET 50
1,169
(1.2)
8.6
17.8
USA
Dow Jones
24,965
(4.0)
7.3
20.4
UK
FTSE
7,247
(6.3)
(1.8)
(0.8)
Japan
Nikkei
21,925
(7.7)
(2.0)
12.7
Germany
DAX
12,488
(7.0)
(3.9)
4.3
France
CAC
5,290
(4.3)
(0.6)
9.2
Source: Bloomberg, Angel Research p68in4
Market Outlook
February 21, 2018
Research Team Tel: 022 - 39357800
DISCLAIMER
Angel Broking Private Limited (hereinafter referred to as “Angel”) is a registered Member of National Stock Exchange of India
Limited,Bombay Stock Exchange Limited and Metropolitan Stock Exchange Limited. It is also registered as a Depository Participant with
CDSL and Portfolio Manager with SEBI. It also has registration with AMFI as a Mutual Fund Distributor. Angel Broking Private Limited is a
registered entity with SEBI for Research Analyst in terms of SEBI (Research Analyst) Regulations, 2014 vide registration number
INH000000164. Angel or its associates has not been debarred/ suspended by SEBI or any other regulatory authority for accessing
/dealing in securities Market. Angel or its associates/analyst has not received any compensation / managed or
co-managed public offering of securities of the company covered by Analyst during the past twelve months.
This document is solely for the personal information of the recipient, and must not be singularly used as the basis of any investment
decision. Nothing in this document should be construed as investment or financial advice. Each recipient of this document should make
such investigations as they deem necessary to arrive at an independent evaluation of an investment in the securities of the companies
referred to in this document (including the merits and risks involved), and should consult their own advisors to determine the merits and
risks of such an investment.
Reports based on technical and derivative analysis center on studying charts of a stock's price movement, outstanding positions and
trading volume, as opposed to focusing on a company's fundamentals and, as such, may not match with a report on a company's
fundamentals. Investors are advised to refer the Fundamental and Technical Research Reports available on our website to evaluate the
contrary view, if any.
The information in this document has been printed on the basis of publicly available information, internal data and other reliable
sources believed to be true, but we do not represent that it is accurate or complete and it should not be relied on as such, as this
document is for general guidance only. Angel Broking Pvt. Limited or any of its affiliates/ group companies shall not be in any way
responsible for any loss or damage that may arise to any person from any inadvertent error in the information contained in this report.
Angel Broking Pvt. Limited has not independently verified all the information contained within this document. Accordingly, we cannot
testify, nor make any representation or warranty, express or implied, to the accuracy, contents or data contained within this document.
While Angel Broking Pvt. Limited endeavors to update on a reasonable basis the information discussed in this material, there may be
regulatory, compliance, or other reasons that prevent us from doing so.
This document is being supplied to you solely for your information, and its contents, information or data may not be reproduced,
redistributed or passed on, directly or indirectly.
Neither Angel Broking Pvt. Limited, nor its directors, employees or affiliates shall be liable for any loss or damage that may arise from
or in connection with the use of this information.